. 2000 Feb 15;523 Pt 1(Pt 1):117-30.
doi: 10.1111/j.1469-7793.2000.t01-1-00117.x.

Mechanically gated channel activity in cytoskeleton-deficient plasma membrane blebs and vesicles from Xenopus oocytes

Affiliations

Mechanically gated channel activity in cytoskeleton-deficient plasma membrane blebs and vesicles from Xenopus oocytes

Y Zhang et al. J Physiol. .

Abstract

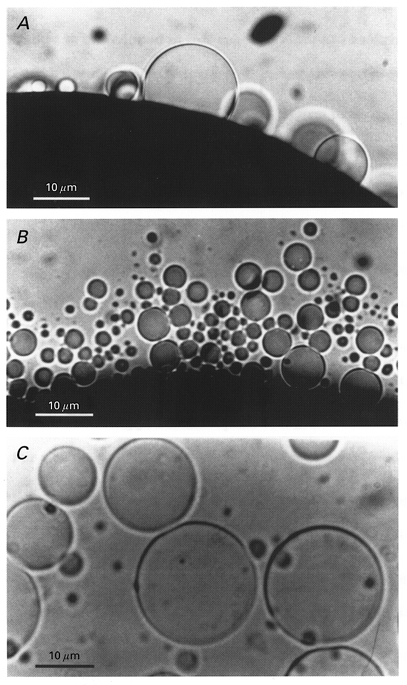
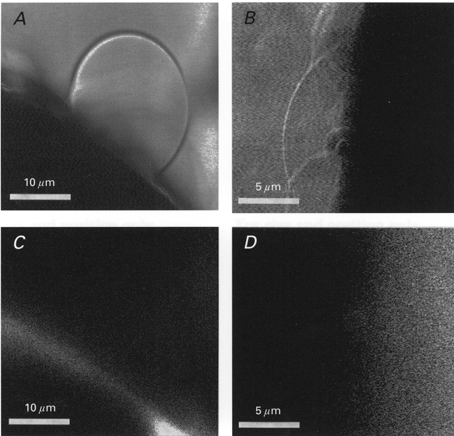
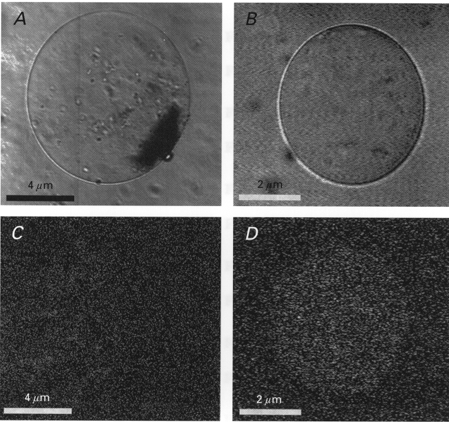
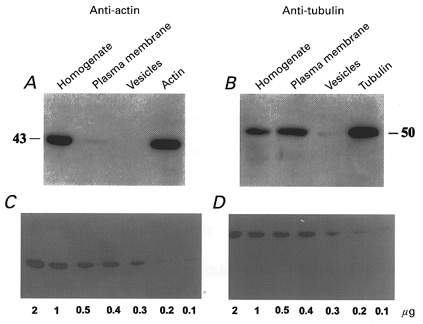
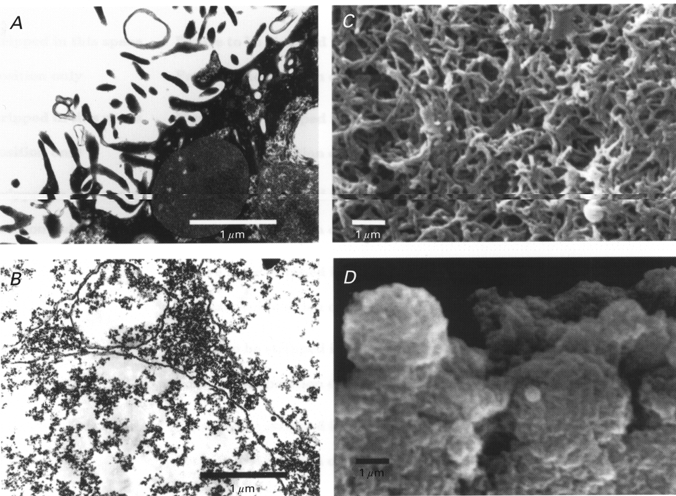
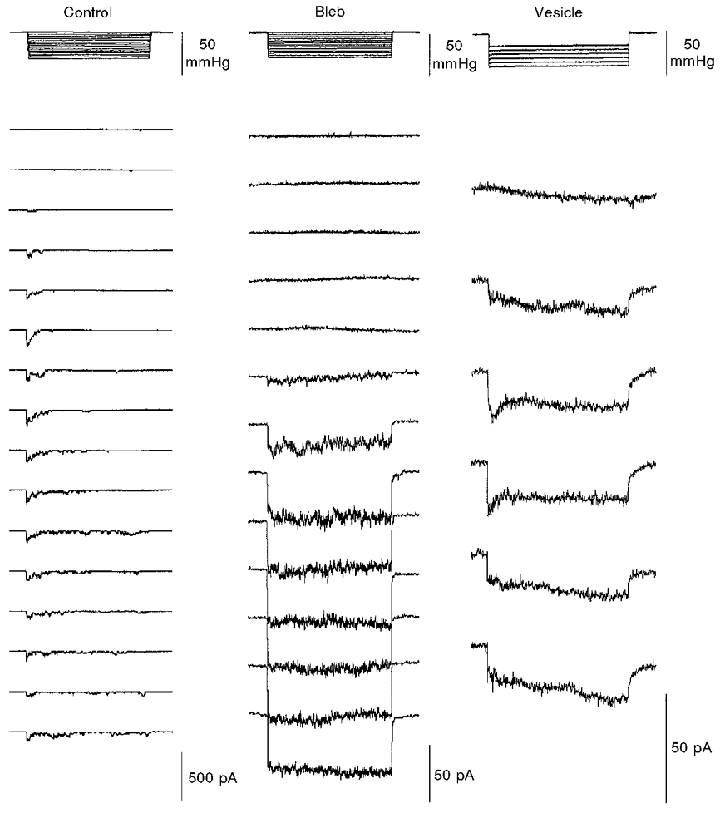
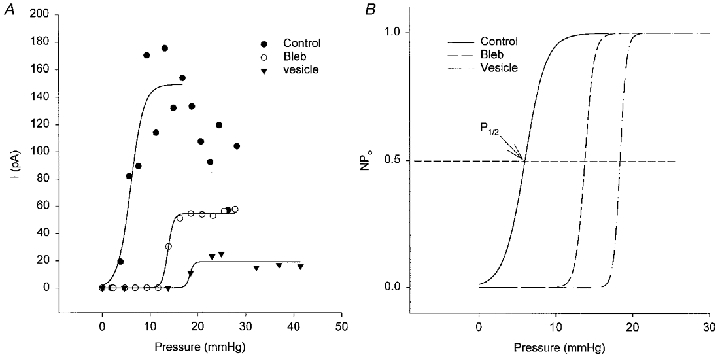
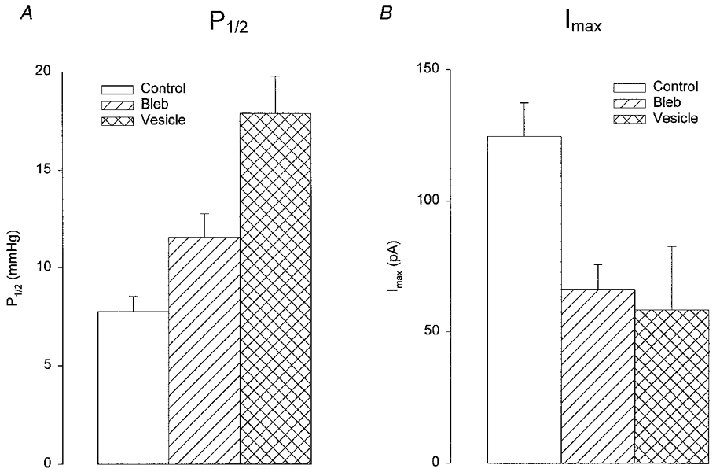
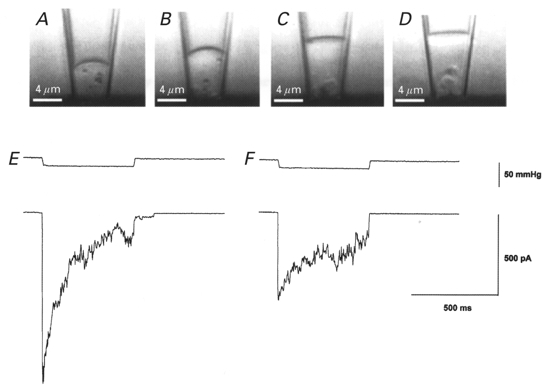
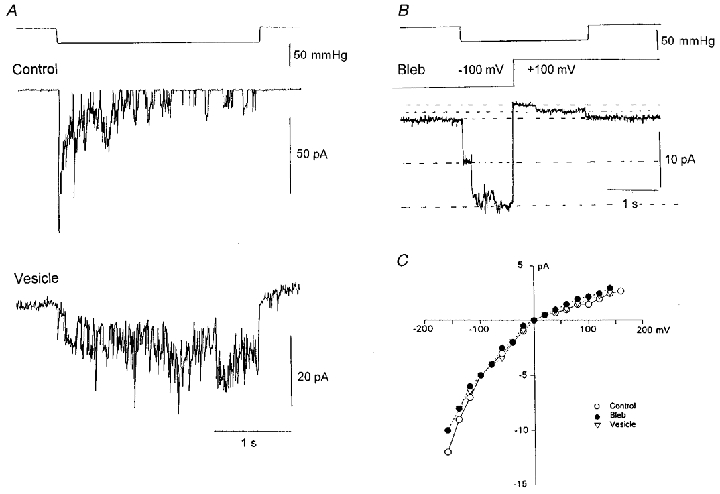
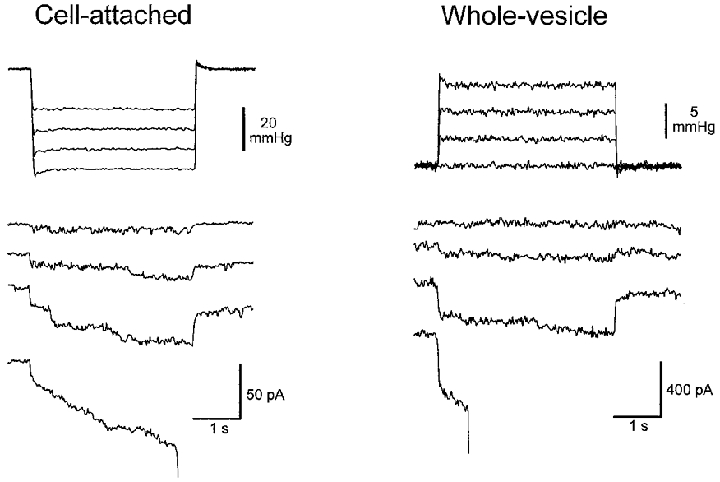
1. A novel technique involving hypertonic stress causes membrane 'blebbing' of the Xenopus oocyte and the shedding of plasma membrane vesicles (PMVs). 2. Confocal fluorescence microscopy, immunocytochemistry and electron microscopy indicate that blebs and PMVs lack cortical cytoskeleton and are deficient in cytoskeleton proteins and devoid of microvilli. 3. Patch recordings from PMVs consistently reveal mechanically gated (MG) channel activity. The MG channels display the same single-channel conductance as control recordings but differ in terms of reduced mechanosensitivity and adaptation to sustained stimulation. 4. Whole PMV recordings show rapid and reversible activation of mechanosensitive currents in response to pressure pulses. The maximal currents activated in PMVs are consistent with MG channel activity recorded in patches. 5. The discrepancy between MG channel activity recorded in whole PMVs and oocytes most probably reflects their different membrane geometry and ability to develop activating bilayer tensions. 6. We propose that membrane blebbing, which is known to occur under specific physiological and pathological conditions (e.g. mitosis and apoptosis), may increase mechanosensitivity independently of the intrinsic properties of membrane proteins.


Figures

Figure 1
Figure 1. Photomicrographs of hypertonicity-induced plasma membrane blebs and vesicles
A, the blebs appear as transparent membrane blisters on the surface of the oocyte devoid of the pigment granules that darken the cytoplasm of the oocyte. B, the focus has been changed to the bottom of the dish and shows the accumulated PMVs. C, image of several PMVs showing their spherical shape and optically smooth membrane.
Figure 2
Figure 2. Confocal images showing actin and tubulin distribution in plasma membrane blebs of Xenopus oocytes
A and B, light images of the blebbed surface of two oocytes. C, corresponding fluorescence image for A of the NBD-phallacidin-labelled bleb and its parental oocyte. D, corresponding fluorescent image for B of DCVJ-labelled blebs and their parental oocyte.
Figure 3
Figure 3. Confocal images of two PMVs from an NBD-phallacidin-labelled oocyte
A and C, light images of two different vesicles. B and D, corresponding fluorescence images of the two vesicles.
Figure 4
Figure 4. Western blots of homogenate, plasma membrane and vesicles of Xenopus oocytes
Actin (A) and tubulin (B) were labelled with anti-actin and anti-tubulin antibodies, respectively. The resolution limits of the technique were calibrated with different concentrations of actin (C) and tubulin (D).
Figure 5
Figure 5. Transmission and scanning electron microscopy of oocyte surface and plasma membrane vesicles
A, TEM of a portion of the oocyte surface showing prominent microvilli containing dark cytoplasmic material. B, TEM of PMVs indicating a smooth, even trilaminar membrane, with no evidence of particles or fibres associated with the cytoplasmic side of the membrane. C, SEM of the oocyte surface indicating the high density of microvilli. D, SEM of PMVs indicating a basically smooth surface membrane with no appendages.
Figure 6
Figure 6. Typical recordings of MG channel activities in membrane patches formed on control, blebbed and vesicular membrane
Incremental pressure pulses of 4 s were applied (upper panel) to activate the current responses shown in the lower panel. The membrane potential in all cases was set at −100 mV (from the measured MG current reversal potential). Note the different current scales in the three conditions.
Figure 7
Figure 7. Stimulus-response relations of the MG channels in control, blebbed and vesicular membrane
A, symbols show peak MG channel currents measured from the currents in Fig. 6 as a function of applied pressure. The lines were obtained by fitting these values to Boltzmann relations. B shows normalized Po-pressure relations. As indicated in B, half-activation pressure (P1/2) represents the pressure at which Po reaches 0.5.
Figure 8
Figure 8. Comparison of mechanosensitivity of MG channels and maximal MG channel currents in membrane patches from control oocytes, blebs and vesicles
The P1/2 values (A) and maximum current (Imax; B) were estimated from the Boltzmann relations shown in Fig. 7. The data derives from 15 control patches, 23 bleb patches and 8 vesicle patches. Error bars indicate s.e.m.s. The level of significance for bleb and PMV differences compared with control was either P < 0.01 or P < 0.05.
Figure 10
Figure 10. Images and MG current recordings of a membrane patch in response to repetitive mechanical stimulation
The top panels (A–D) show video images of a cell-attached patch at different times after the formation of the tight seal and the bottom panels (E and F) show the current response at the time of image A and D, respectively. Between each image, short (100 ms) suction and pressure step protocols were applied (not shown). A, the first image taken soon after seal formation shows the patch slightly curved and located close (≈5 μm) to the cell surface. Particles located in the cytoplasm displayed no motion presumably because they were immobilized on cytoskeleton structures. B-D, with repetitive stimulus protocols, the patch progressively moved up the pipette away from the cell and a clear space (most evident in D) developed between the membrane and cytoskeleton structures remaining close to the cell. Cytoplasmic particles that moved into this clear space displayed Brownian motion indicating the absence of constraining structures (see also Sokabe & Sachs, 1990). E, application of a pressure pulse at the time of image A caused a rapid increase in MG channel activity that then adapted (i.e. closed) in the presence of sustained stimulation. F, application of the same pressure pulse at the time of image D caused activation of a smaller response that showed reduced adaptation. The patch pipette tip diameter was ≈4 μm.
Figure 9
Figure 9. Single MG channel current behaviour in control, vesicle and bleb membrane
A, the current response to identical suction steps in cell-attached patches on an oocyte and a vesicle. Patch potential was set to give a −150 mV driving force (from the reversal potential of the MG current). The single-channel current amplitudes in control oocytes and PMVs were 12 and 10 pA, respectively. The two recordings were made with pipettes from a single capillary pull to ensure identical pipette tip dimensions. Note the typical noisy background vesicle current. B, demonstration of the strong rectification of MG channelscurrents recorded on a membrane bleb. While the suction step was maintained (top trace) the voltage was switched from −100 mV (8 pA) to +100 mV (1.6 pA). The current transient associated with the voltage step was removed by subtraction using a current trace with no applied pressure step. C, current-voltage relations measured on control, bleb and vesicle membranes. The data points are the mean of 5–10 individual MG channel currents measured directly from the oscilloscope screen at different voltages. The data were shifted to give a reversal potential of ≈0 mV. The pipette solution in all recordings contained 100 mm KCl and 5 mm K-Hepes.
Figure 11
Figure 11. Recordings of mechanosensitive currents from a cell-attached patch and from the same whole vesicle
The membrane potential was held at −50 mV for both configurations (pipette potentials were +50 and −50 mV for the cell-attached patch and the whole vesicle, respectively). Left, MG channel activity in response to incrementing suction 4 s duration pulses that ultimately ruptured the patch. Right, MS currents in whole-cell configuration in response to incrementing 4 s duration pressure pulses applied to inflate the vesicle. The whole vesicle mechanosensitive current activated in the 3rd current trace turned off rapidly with the pressure step. The last pressure step activated the MS current but after a delay also ruptured the vesicle. Note the different pressure and current scales.

Similar articles

Cited by

References

    1. Assad JA, Shephard GMG, Corey DP. Tip link integrity and mechanical transduction in vertebrate hair cells. Neuron. 1991;7:985–994. - PubMed
    1. Casado M, Ascher P. Opposite modulation of NMDA receptors by lysophospholipids and arachidonic acid: common features with mechanosensitivity. The Journal of Physiology. 1998;513:317–330. - PMC - PubMed
    1. Corey DP, Hudspeth AJ. Kinetics of the receptor current in bullfrog saccular hair cells. Journal of Neuroscience. 1983;3:962–976. - PMC - PubMed
    1. Erikson CA, Trinkaus JP. Microvilli and blebs as sources of reserve surface membrane during cell spreading. Experimental Cell Research. 1976;99:375–384. - PubMed
    1. Gard DL. γ-Tubulin is asymmetrically distributed in the cortex of Xenopus oocytes. Developmental Biology. 1994;161:131–140. - PubMed

Publication types

LinkOut - more resources