. 2011 Apr;39(8):3141-55.
doi: 10.1093/nar/gkq1276. Epub 2010 Dec 9.

Pre-replication complex proteins assemble at regions of low nucleosome occupancy within the Chinese hamster dihydrofolate reductase initiation zone

Affiliations

Pre-replication complex proteins assemble at regions of low nucleosome occupancy within the Chinese hamster dihydrofolate reductase initiation zone

Yoav Lubelsky et al. Nucleic Acids Res. 2011 Apr.

Abstract

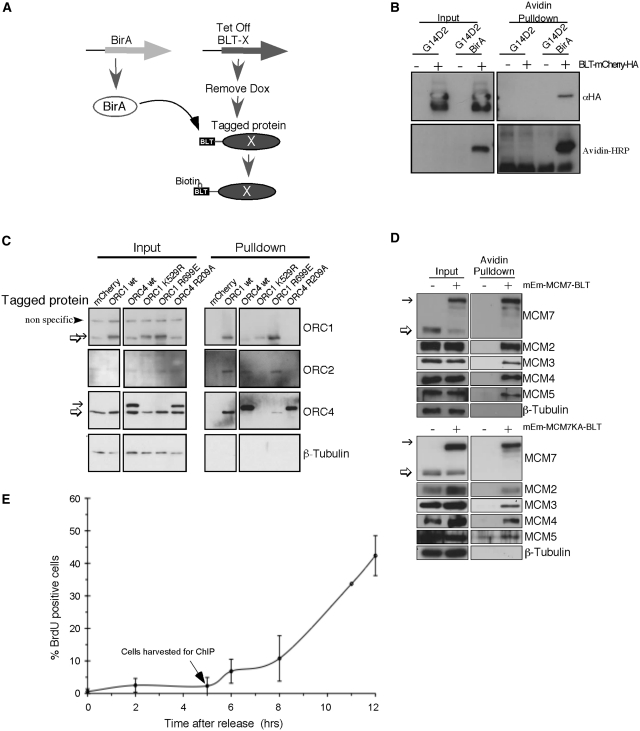
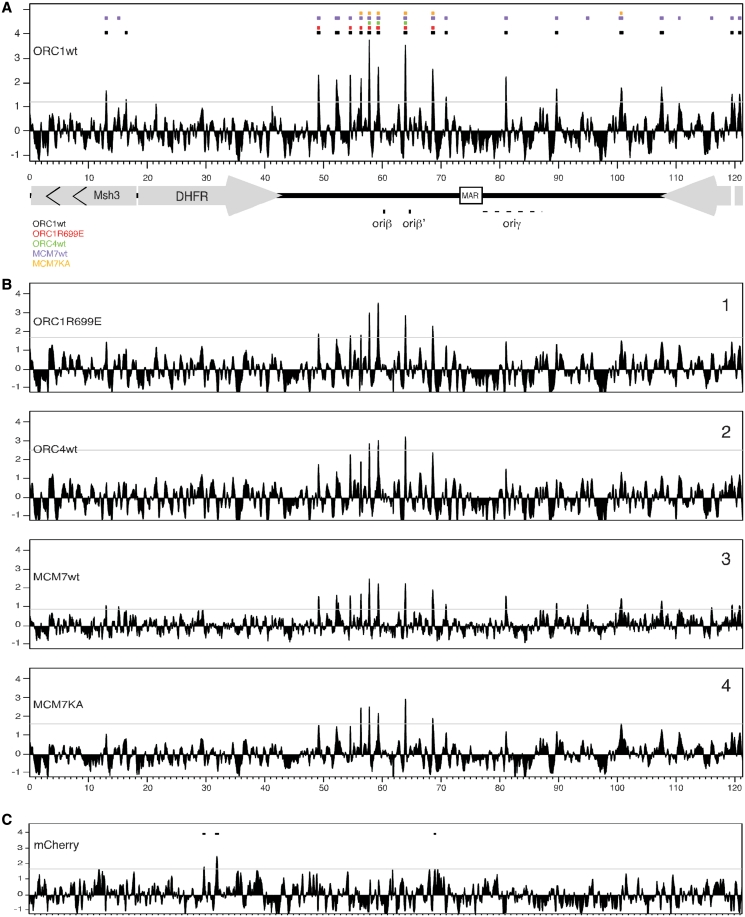
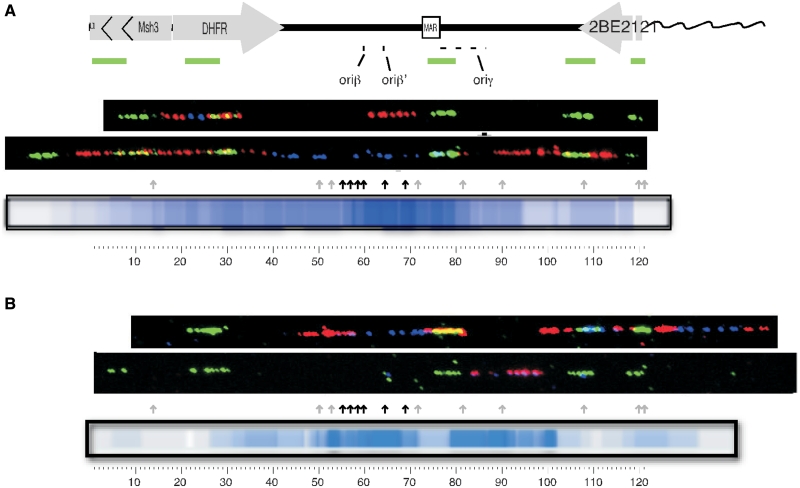
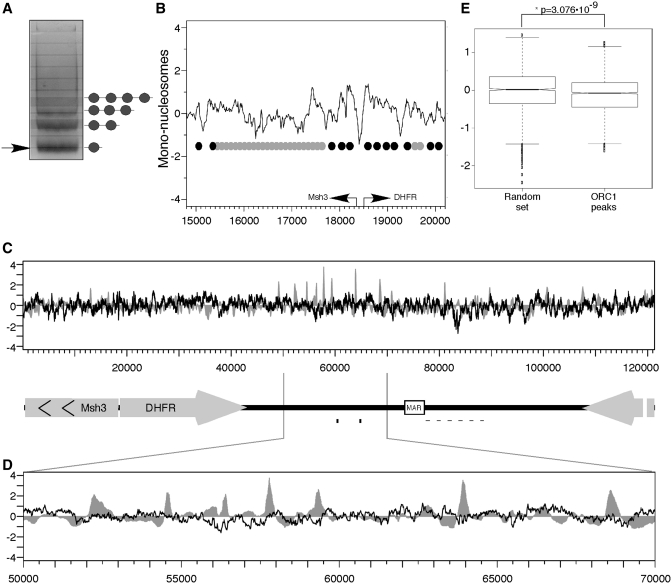
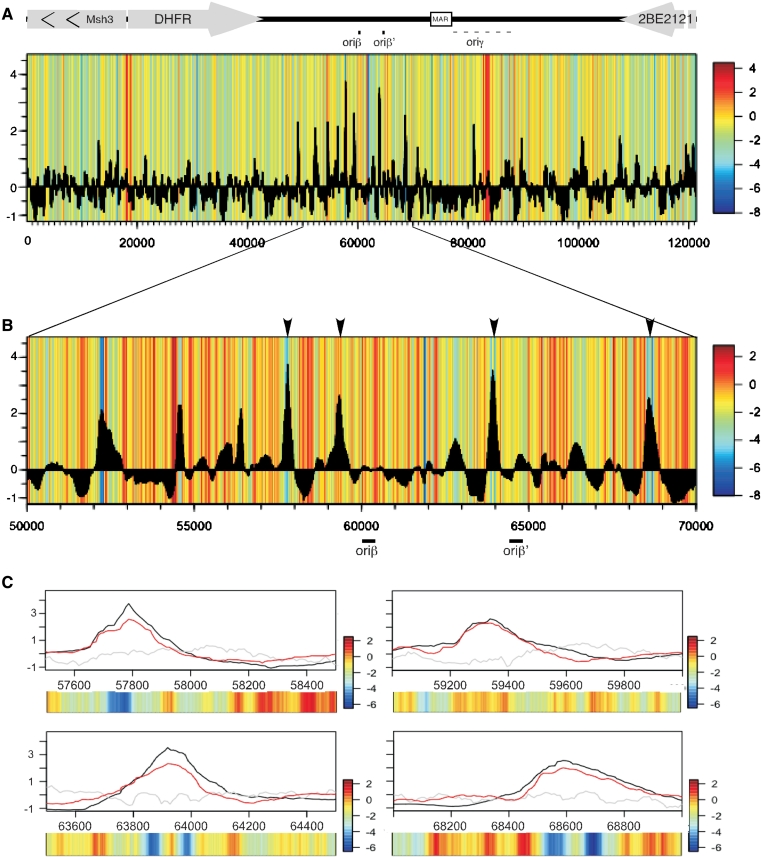
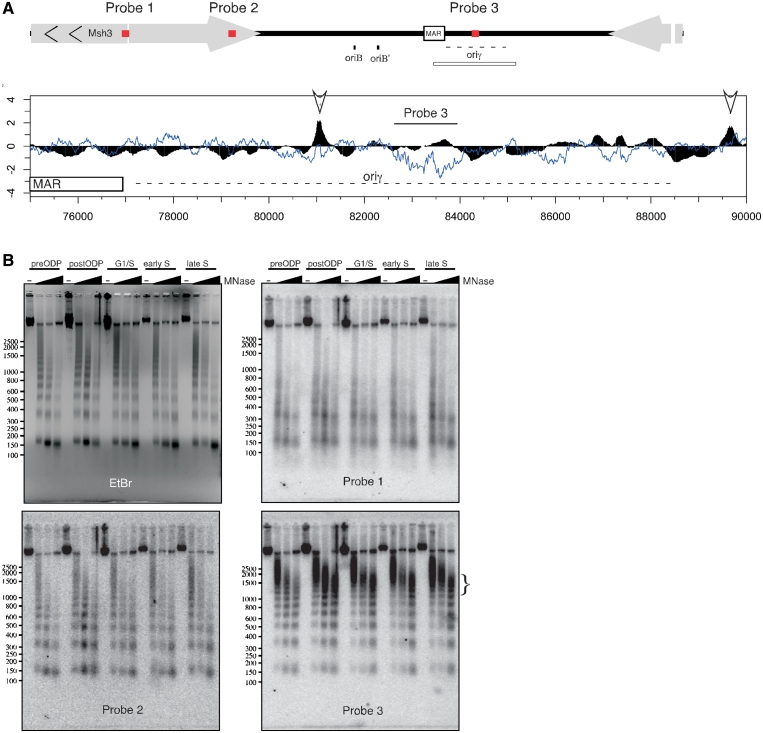
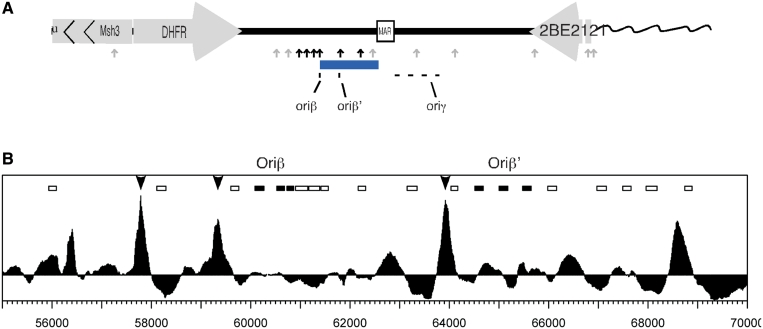
Genome-scale mapping of pre-replication complex proteins has not been reported in mammalian cells. Poor enrichment of these proteins at specific sites may be due to dispersed binding, poor epitope availability or cell cycle stage-specific binding. Here, we have mapped sites of biotin-tagged ORC and MCM protein binding in G1-synchronized populations of Chinese hamster cells harboring amplified copies of the dihydrofolate reductase (DHFR) locus, using avidin-affinity purification of biotinylated chromatin followed by high-density microarray analysis across the DHFR locus. We have identified several sites of significant enrichment for both complexes distributed throughout the previously identified initiation zone. Analysis of the frequency of initiations across stretched DNA fibers from the DHFR locus confirmed a broad zone of de-localized initiation activity surrounding the sites of ORC and MCM enrichment. Mapping positions of mononucleosomal DNA empirically and computing nucleosome-positioning information in silico revealed that ORC and MCM map to regions of low measured and predicted nucleosome occupancy. Our results demonstrate that specific sites of ORC and MCM enrichment can be detected within a mammalian initiation zone, and suggest that initiation zones may be regions of generally low nucleosome occupancy where flexible nucleosome positioning permits flexible pre-RC assembly sites.


Figures

Figure 1.
Figure 1.
Establishment of in vitro protein biotinylation system. (A) Schematic of the experimental system used to generate specifically biotinylated proteins. Block arrows represent genes and ovals represent the expressed transgenic protein (X). The Biotin Ligase Target (BLT) tag is shown as a black rectangle. (B) Parental cell line (G14D2) and E. coli biotin ligase (BirA) expressing cells (G14D2 BirA) were transfected with a BLT and HA-tagged mCherry. The tagged protein was expressed in both cell lines (top panel left) but was biotinylated (left bottom panel) and could be pulled down by Streptavidin beads only in the BirA expressing cell line (right panels). The lower molecular weight band is most likely a degraded protein lacking the N-terminus but retaining the C-terminal HA tag. (C) Cells expressing various tagged ORC subunits (indicated above each lane) were used for avidin pulldown and probed with antibodies against ORC1 (top), ORC2 (second panel) and ORC4 (third panel). β-Tubulin (bottom) was used as loading control. Note that due to the large size of ORC1, the tagged protein migrates only slightly slower than the endogenous protein. (D) Cells expressing BLT-tagged MCM7 (+) or no tagged protein (−) were used for avidin pulldown and probed with antibodies against MCM7 (top), MCM2, MCM3, MCM4 and MCM5. β-Tubulin (bottom) was used as a loading control. In (C) and (D), the thin arrow indicates the tagged subunits while the thick arrow indicates the endogenous protein. (E) Mitotic cells were released and pulsed labeled with BrdU for 30 min at different time points. The fraction of BrdU positive cells was determined by immunofluorescence (error bars represent the standard deviation of three independent experiments). The arrow indicates the point in late G1 when cells were collected for pulldown.
Figure 2.
Figure 2.
ChAP-chip of pre-RC subunits. Cross-linked chromatin from cells expressing tagged pre-RC subunits was precipitated using Streptavidin conjugated beads and the extracted DNA was hybridized to a custom high-density NimbleGen tiling array. Array results were analyzed using MA2C. Peaks were called using a false discovery rate with the threshold set at FDR A) The MA2C scores for wtORC1 are presented as a histogram. Colored rectangles on top indicate peak calls for each subunit detected in (B). (B) MA2C scores for ORC1R699E (1), ORC4wt (2), MCM7wt (3) and MCM7KA (4) mapped by ChAP. (C) ChAP results for the BLT-tagged mCherry used as negative control. Peak calls are indicated by rectangles.
Figure 3.
Figure 3.
Replication initiates near sites of ORC ChAP peaks: either asynchronously growing cells (A) or cells synchronized at the G1/S border with aphidicolin (B) were pulse labeled with IdU (blue) for 20 min and then chased with CldU (red) for 20 min each. DNA fibers were prepared and aligned to each other and to the DHFR map using a combination of unevenly spaced FISH probes (green). Initiation sites for replication within each fiber were identified as patterns of either red–blue–red (initiation during the IdU label and elongation during CldU), red–blue–empty–blue–red (initiation prior to the IdU label and elongation during both labels) or red only (initiation during the CldU label). A heat map consolidating the amount of label associated with each initiation pattern is shown. Arrows mark the position of ORC peaks (grey arrows denotes peaks containing only the wt ORC and MCM while black arrows denote peaks containing both the wt and the ATPase mutants) the locations of oriβ, oriβ′ and oriγ are shown. The appearance of a more de-localized set of initiations in the aphidicolin-arrested cells may result from the induction of dormant origins upon fork arrest (11). Low initiation activity near the MAR in aphidicolin-arrested cells has been reported before (48). Data represent the results from 32 and 27 individual fibers for asynchronous and aphidicolin arrested cells respectively, shown in Supplementary Figure S1.
Figure 4.
Figure 4.
Mapping nucleosome positions. (A) Chromatin was digested with Microccocal nuclease. Digested DNA was separated on 2% agarose gel and the mono-nucleosome fraction was extracted and hybridized to NimbleGen tiling array. (B) Nucleosome positions mapped by hybridization of mono-nucleosome DNA in the vicinity of the DHFR-Msh3 bi-directional promoter are shown. Arrows represent the transcription start sites of the DHFR and Msh3 genes. Circles indicate a suggested nucleosome arrangement. Black circles indicate positioned nucleosomes (distinct peak with a size of ≈150 bp) while grey circles indicate non-positioned nucleosomes. (C) Alignment of ORC1 ChAP (grey) with mono-nucleosomal DNA (black). (D) Blowup of the region between 50 000 and 70 000 containing the majority of the pre-RC's. (E) The nucleosome scores in the regions of wtORC1 peaks were compared to those of 10 random sets of the same size; the score in the peaks was significantly lower than the random set (*P = 3.076 × 10−9).
Figure 5.
Figure 5.
Pre-RCs align with region of low nucleosome positioning information. (A) The calculated nucleosome positioning value of sequences along the DHFR locus is presented as a color map with red indicating high values of positioning information and blue low values. The heat map was aligned with ORC1 ChAP data (black histogram). (B) Nucleosome predictions for the oriβ/β′ region (50 000–70 000) aligned to the ORC1 ChAP. The positions of oriβ and oriβ′ are marked by black lines. (C) A 1 kb region surrounding the peaks marked by arrows in (B). The ChAP results for ORC1wt (black) are overlaid with the ChAP results for MCM7wt (red) and mono-nucleosomes (gray). The nucleosome positioning scores for each region are shown as a heatmap.
Figure 6.
Figure 6.
The oriγ region is highly protected by a non-nucleosome complex throughout the cell cycle. (A) Schematic of probe positions (red rectangles) relative to the entire DHFR region in the top diagram. All probes were 1300 bp long. Below is an alignment of ORC1 ChAP (black) to mono-nucleosomal DNA (blue) along the region of the DHFR locus containing the matrix attachment region (MAR) and the secondary initiation zone, oriγ (indicated by the open rectangle below the diagram at the top). Arrows indicate the significant ORC peaks in this region. (B) CHOC400 cells were collected at different stages of the cell cycle and nuclei were treated with increasing amount of MNase. DNA was extracted and separated on 2% agarose gel. Southern blots performed using probes against the DHFR promoter (probe 1, position 17 816–19 115), the oriγ region (probe 3, position 82 621–83 949) and a control region in the DHFR CDS (probe 2, position 37 623–38 973). The enriched, high molecular weight fraction, seen with probe 3 is marked by the vertical bracket on the side of the panel.
Figure 7.
Figure 7.
pre-RC ChIP peaks are in close proximity to the sites of initiation. (A) Summary of results. Arrows indicate the ChAP peaks. Black arrows represent peaks that contain both wt and mutant ORC and MCM while grey arrows represent peaks with only wt present. The blue rectangle indicates the area with highest density of labeled fibers. The previously described preferred initiation sites are shown at the bottom. (B) ChAP results for the region containing the previously described major initiation site. The arrows indicate the peaks in which all tested pre-RC subunits were detected. The rectangles represent the probes shown in Figure 3 of Kobayashi et al. (46). Among them, the filled rectangles represent the probes that were mapped to the two initiation sites oriβ and oriβ′.

Similar articles

Cited by

References

    1. Eaton ML, Galani K, Kang S, Bell SP, MacAlpine DM. Conserved nucleosome positioning defines replication origins. Genes Dev. 2010;24:748–753. - PMC - PubMed
    1. Kearsey S. Analysis of sequences conferring autonomous replication in baker's yeast. EMBO J. 1983;2:1571–1575. - PMC - PubMed
    1. Masai H, Matsumoto S, You Z, Yoshizawa-Sugata N, Oda M. Eukaryotic chromosome DNA replication: where, when, and how? Annu. Rev. Biochem. 2010;79:89–130. - PubMed
    1. Chuang RY, Kelly TJ. The fission yeast homologue of Orc4p binds to replication origin DNA via multiple AT-hooks. Proc. Natl Acad. Sci. USA. 1999;96:2656–2661. - PMC - PubMed
    1. Gilbert DM. In search of the holy replicator. Nat. Rev. Mol. Cell. Biol. 2004;5:848–855. - PMC - PubMed

Publication types