. 2019 Jul;571(7764):284-288.
doi: 10.1038/s41586-019-1355-4. Epub 2019 Jul 1.

Smoothened stimulation by membrane sterols drives Hedgehog pathway activity

Affiliations

Smoothened stimulation by membrane sterols drives Hedgehog pathway activity

Ishan Deshpande et al. Nature. 2019 Jul.

Abstract

Hedgehog signalling is fundamental to embryonic development and postnatal tissue regeneration1. Aberrant postnatal Hedgehog signalling leads to several malignancies, including basal cell carcinoma and paediatric medulloblastoma2. Hedgehog proteins bind to and inhibit the transmembrane cholesterol transporter Patched-1 (PTCH1), which permits activation of the seven-transmembrane transducer Smoothened (SMO) via a mechanism that is poorly understood. Here we report the crystal structure of active mouse SMO bound to both the agonist SAG21k and to an intracellular binding nanobody that stabilizes a physiologically relevant active state. Analogous to other G protein-coupled receptors, the activation of SMO is associated with subtle motions in the extracellular domain, and larger intracellular changes. In contrast to recent models3-5, a cholesterol molecule that is critical for SMO activation is bound deep within the seven-transmembrane pocket. We propose that the inactivation of PTCH1 by Hedgehog allows a transmembrane sterol to access this seven-transmembrane site (potentially through a hydrophobic tunnel), which drives the activation of SMO. These results-combined with signalling studies and molecular dynamics simulations-delineate the structural basis for PTCH1-SMO regulation, and suggest a strategy for overcoming clinical resistance to SMO inhibitors.


Figures
Extended Data Fig. 1 |
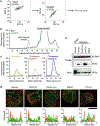
Extended Data Fig. 1 |. NbSmo8 is selective for active SMO.
a, Gating scheme for flow cytometry experiments in Fig. 1b with selection of yeast singlets for analysis. b, Fluorescent size-exclusion chromatography traces of 2 μM NbSmo8–Alexa647 incubated with 0.9 μM SMO incubated with or without 25 μ M SAG21k. NbSmo8 co-elutes with SMO–SAG21k with an elution volume of 12.5 ml. c, Fluorescent size-exclusion chromatography traces of NbSmo8–Alexa647 as in b, with SMO purified in the presence of cholesterol–LMNG micelles (yellow). Dashed traces depict apo (black) and SAG21k (green) conditions shown in b. Cholesterol potentiates NbSmo8 binding. SANT-1 (25 μM) (red) completely prevents NbSmo8 binding. SAG21k is cooperative with cholesterol and increases NbSmo8 binding (blue). d, Representative line scans (pixel intensity versus distance, both in arbitrary units) for cells in Fig. 1d. Dashed white line indicates the location of the scan. Scale bar, 10 μm. e, Co-immunoprecipitation of NbSmo8 is dependent on SMO activation. Flag–SMO was co-expressed in suspension HEK293 cells with GFP-tagged versions of NbSmo8 or Nb80, a control nanobody specific to the β2-adrenergic receptor with no affinity for SMO. After stimulation with DMSO (vehicle), KAAD-cyclopamine (KAAD-cyc), SAG21k or MβCD, cells were solubilized in LMNG and SMO–nanobody complexes were isolated using M1 Flag affinity resin. SMO (anti-Flag antibody) and NbSmo8 or Nb80 (anti-GFP antibody) were evaluated via immunoblotting.
Extended Data Fig. 2 |
Extended Data Fig. 2 |. NbSmo8 recognition of active SMO.
a, Overall structure of active SMO bound to NbSmo8. The three highly variable nanobody CDRs are highlighted in different colours. b, Close-up view of the interface. NbSmo8 CDRs recognize a large intracellular cavity in active SMO. c, Intracellular view of active SMO cavity stabilized by NbSmo8. Surface is coloured by regions that are contacted by a specific NbSmo8 CDR. NbSmo8 recognizes a unique three-dimensional epitope, with each CDR making important contributions to overall binding. d, CDR1 makes important contacts with SMO intracellular loop (ICL) 3. e, CDR2 residues interact with ICL2 and ICL3. f, The long CDR3 has a complex fold that reaches deep inside the active SMO cavity and stabilizes an outwardly displaced conformation of TM6.
Extended Data Fig. 3 |
Extended Data Fig. 3 |. Activation-induced changes in SMO.
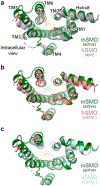
ac, Cytoplasmic view of 7TM helix rearrangements of active SMO–SAG21k–NbSmo8 (green) compared with apo hSMO (PDB code 5L7D) (grey) (a), inactive hSMO (PDB code 5L7I) (salmon) (b) and intermediate active xSMO (PDB code 6D32) (cyan) (c). In all panels, the TM6 outward movement and TM5 inward movement are highlighted with a red arrow.
Extended Data Fig. 4 |
Extended Data Fig. 4 |. Unique binding mode of 7TM cholesterol.
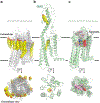
a, All experimentally determined GPCR structures in the PDB with a modelled cholesterol (60 individual structures) are shown overlaid with receptors shown in light grey. In each case, cholesterol binds outside of the 7TM bundle. b, c, By contrast, the 7TM cholesterol in active SMO binds within the 7TM bundle (b), which is highly similar to the binding mode of agonists bound to active GPCRs (c) (eight individual structures; agonists are shown in unique colours, and GPCRs in light green transparency).
Extended Data Fig. 5 |
Extended Data Fig. 5 |. Molecular dynamics of active SMO.
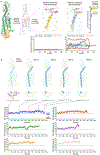
All atom molecular dynamics simulations of SMO were performed in the absence of SAG21k and NbSmo8 to assess the stability of 7TM cholesterol and the overall stability of the active conformation. a, A model of active SMO derived from lower-resolution data had initially placed cholesterol in an opposite ‘flipped’ orientation (right panel and graph), with the hydroxyl pointing towards the intracellular side. In five out of six simulations starting from such a pose, cholesterol displayed substantial movement deeper into the 7TM pocket. By contrast, the correctly modelled cholesterol (left panel and graph) was stable over all six simulations, showing an overall root mean squared deviation of 1 Å from the starting position. Close-up view of the binding pockets shows simulation frames sampled every 50 ns from a representative simulation as transparent sticks. b, Even after removal of NbSmo8 and SAG21k, TM6 remains close to its initial position but can adopt slightly outward conformations. The displacement of Cα D259 in TM6 from Cα K448 in TM1 is used to track TM6 movement (Methods); these atoms are shown as spheres. Individual structural snapshots from a representative simulation are shown with the conformation of TM6 highlighted in blue. For comparison, the structure of inactive SMO is shown in the intracellular view (salmon cartoon). TM6 spontaneously returns to the crystallographic conformation after outward displacements, which provides confidence in the observed state stabilized by NbSmo8.
Extended Data Fig. 6 |
Extended Data Fig. 6 |. SMO mutants bind BODIPY-cyclopamine.
a, Structural modelling of SMO mutations that line the deep 7TM sterol pocket. Wild-type residues are shown as green sticks. Grey sticks show the most -common rotamer of each engineered mutation that does not clash with neighbouring residues in SMO. Red regions show clashes between engineered mutations and cholesterol. b, Gating scheme for BODIPY-cyclopamine (BODIPY-cyc) binding flow cytometry experiments with selection of single cells for analysis. c, Example of flow cytometry plots showing percentage of BODIPY-cyclopamine+ cells with and without competition with KAAD-cyclopamine. Plots shown are for cells that express wild-type SMO. d, Engineered mutations in SMO used to probe the 7TM sterol site and the hydrophobic tunnel are fully competent to bind BODIPY-cyclopamine, which indicates that these mutations fold and traffic to the cellular membrane. Some mutants (including V333F, I412F and T470Q) show increased BODIPY-cyclopamine binding compared to wild-type SMO, which suggests that they stabilize the inactive conformation. Mean ± s.e.m., n = 3 biological replicates. e, Fluorescence size-exclusion chromatography traces of 0.5 μM SMO and SMO(V333F) incubated with 2.5 μM BODIPY-cyclopamine. Both preparations bind BODIPY-cyclopamine, which indicates that the purified proteins are functionally capable of binding ligands.
Extended Data Fig. 7 |
Extended Data Fig. 7 |. Comparison of hydrophobic tunnel in mSMO and xSMO.
Cutaway view of active mSMO (green surface) and cyclopamine-bound xSMO (PDB code 6D32) (cyan surface) in similar orientations. In both cases, a hydrophobic tunnel opening to the inner leaflet of the plasma membrane is observed (outlined in red).
Extended Data Fig. 8 |
Extended Data Fig. 8 |. SMO structural pharmacology at the 7TM site.
a, Comparison of cholesterol bound to active SMO (green cartoon) and SANT-1 bound to inactive SMO (PDB code 4N4W) (grey cartoon). A hydrogen bond between H470 of hSMO (H474 of mSMO) and SANT-1 (dotted black line) stabilizes an inward conformation of TM6. By comparison, the bulky cholesterol methyl groups outwardly displace TM6. Both cholesterol and SANT-1 form a hydrogen bond with Y398. b, Structure–activity relationship of SAG (adapted from ref. ). Bulkier replacements to the 4-amino group (orange circle) that are predicted to clash with the 7TM cholesterol switch the molecular efficacy of SAG from an agonist into an antagonist.
Extended Data Fig. 9 |
Extended Data Fig. 9 |. SMO-inhibitor resistance mutations.
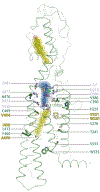
Previously identified hSMO-inhibitor resistance mutations are shown as sticks mapped onto the active mSMO structure. Numbering is for hSMO. Residues highlighted in light violet are within 5 Å of SAG21k. Mutations in this upper site probably directly disrupt inhibitor binding. Residues in yellow are within 5 Å of the 7TM cholesterol. Mutations in these sites probably alter sterol affinity or directly stabilize the active SMO conformation. Residues in green are outside of the 7TM binding pocket and probably stabilize the SMO active state.
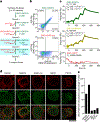
Fig. 1 |
Fig. 1 |. NbSmo8 is a SMO biosensor.
a, Nanobody (Nb)-displaying yeast selective for SAG21k-bound SMO were enriched over multiple rounds. FACS, fluorescence activated cell sorting; KAAD-cyc, KAAD-cyclopamine. b, NbSmo8 shows a strong preference for SAG21k-bound SMO. c, Surface plasmon resonance of SMO binding to immobilized NbSmo8. No NbSmo8 binding was observed for SANT-1-occupied SMO. RU, resonance units. d, NbSmo8-GFP plasma membrane localization in HEK293 cells is dependent on SMO activation. Cells expressing Flag-SMO and NbSmo8-GFP were treated with indicated conditions. Separately, an isogenic stable cell line that co-expressed PTCH1 with Flag-SMO and NbSmo8-GFP was imaged (PTCH1). Scale bar, 10 μm. e, Percentage of cells displaying NbSmo8-GFP at the membrane in d (n = 29–56 cells per condition). MβCD, methyl-β-cyclodextrin.
Fig. 2 |
Fig. 2 |. Structure of activated SMO.
a, Overall structure of SMO-SAG21k-NbSmo8 complex bound to two cholesterol molecules. NAG, N-acetyl glucosamine. b, Comparison of active mSMO to apo and vismodegib-bound hSMO. Large conformational changes in the intracellular domain are coupled with smaller changes within the CRD. Active mSMO shows an upward displacement of TM6 and ECL3 compared with inactive hSMO. c, Active mSMO compared to cyclopamine-bound xSMO. Subtle lateral movements in TM5 and TM6 are highlighted.
Fig. 3 |
Fig. 3 |. The 7TM sterol site is critical for SMO activation.
a, Surface cut-view, highlighting SMO ligand-binding sites. b, FoFc omit density for 7TM cholesterol at 1.5σ (yellow mesh). c, Molecular dynamics simulations reveal a stable pose for 7TM cholesterol. Simulation frames sampled every 50 ns are shown as transparent sticks. df, GLI-luciferase signalling assay of SMO mutations at the deep 7TM site or tunnel entrance (d), with ablation of the hydrogen bond to Y398 (e) or with direct cholesterol–methyl-β-cyclodextrin activation (f). WT, wild type. g, Fluorescent NbSmo8 co-elutes with SMO in cholesterol-laden micelles. Under identical conditions, the V333F mutant does not bind NbSmo8. AU, arbitrary units; mAU, milli-absorbance units. h, A hydrophobic tunnel between TM5 and TM6 connects the inner membrane leaflet to the 7TM pocket. In df, mean ± s.e.m. of n = 3 biological replicates is shown.
Fig. 4 |
Fig. 4 |. SMO pharmacology at the 7TM and CRD sites.
a, Binding pocket of active SMO with antagonist-bound structures of hSMO overlaid. An antagonist functional group would clash with the 7TM cholesterol. b, SANT-1 more closely overlaps with 7TM cholesterol, as compared to the other antagonists. c, FoFc omit density for SAG21k at 2.5σ (blue mesh). d, Comparison of SAG21k in active SMO to SAG1.5 bound to inactive SMO (grey). e, Comparison of CRD cholesterol (chol) site in inactive and active SMO. f, CRD cholesterol FoFc omit density at 1.5σ (yellow mesh). g, Comparison of CRD orientations in all hSMO structures (grey) with active mSMO (green). CRD motions in all hSMO and mSMO structures share a common axis (black line) that varies by about 20°. h, The 120° CRD rotation observed in xSMO occurs along a unique axis.

Similar articles

Cited by

References

    1. Briscoe J & Thérond PP The mechanisms of Hedgehog signalling and its roles in development and disease. Nat. Rev. Mol. Cell Biol. 14, 416–429 (2013). - PubMed
    1. Wu F, Zhang Y, Sun B, McMahon AP & Wang Y Hedgehog signaling: from basic biology to cancer therapy. Cell Chem. Biol. 24, 252–280 (2017). - PMC - PubMed
    1. Huang P et al. Cellular cholesterol directly activates Smoothened in Hedgehog signaling. Cell 166, 1176–1187.e1114 (2016). - PMC - PubMed
    1. Huang P et al. Structural basis of Smoothened activation in Hedgehog signaling. Cell 174, 312–324.e316 (2018). - PMC - PubMed
    1. Byrne EF, Luchetti G, Rohatgi R & Siebold C Multiple ligand binding sites regulate the Hedgehog signal transducer Smoothened in vertebrates. Curr. Opin. Cell Biol. 51, 81–88 (2018). - PMC - PubMed

MeSH terms