. 2021 Jan 15:10:e61037.
doi: 10.7554/eLife.61037.

A flagellate-to-amoeboid switch in the closest living relatives of animals

Affiliations

A flagellate-to-amoeboid switch in the closest living relatives of animals

Thibaut Brunet et al. Elife. .

Abstract

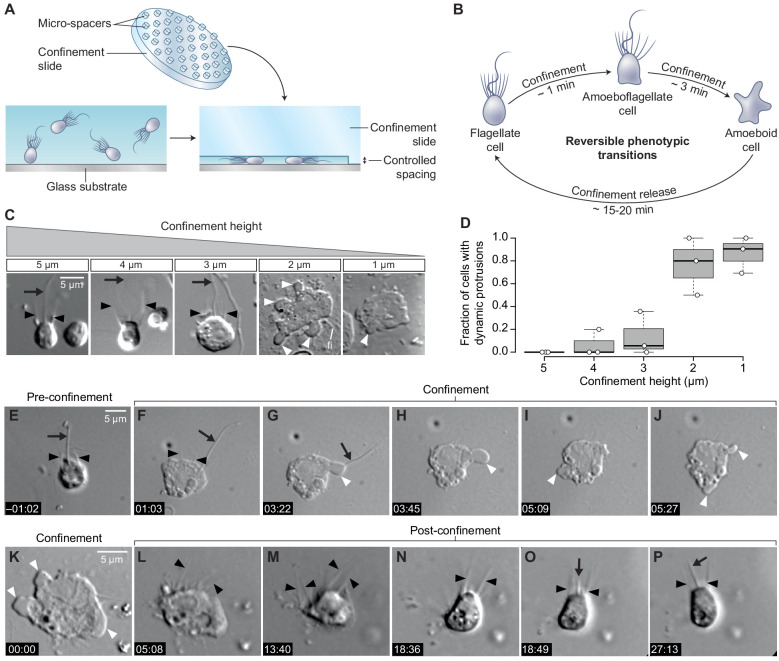
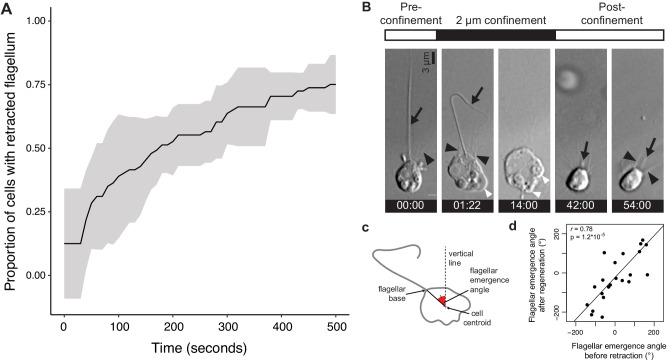
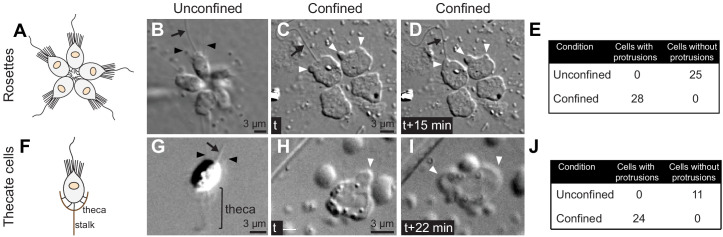
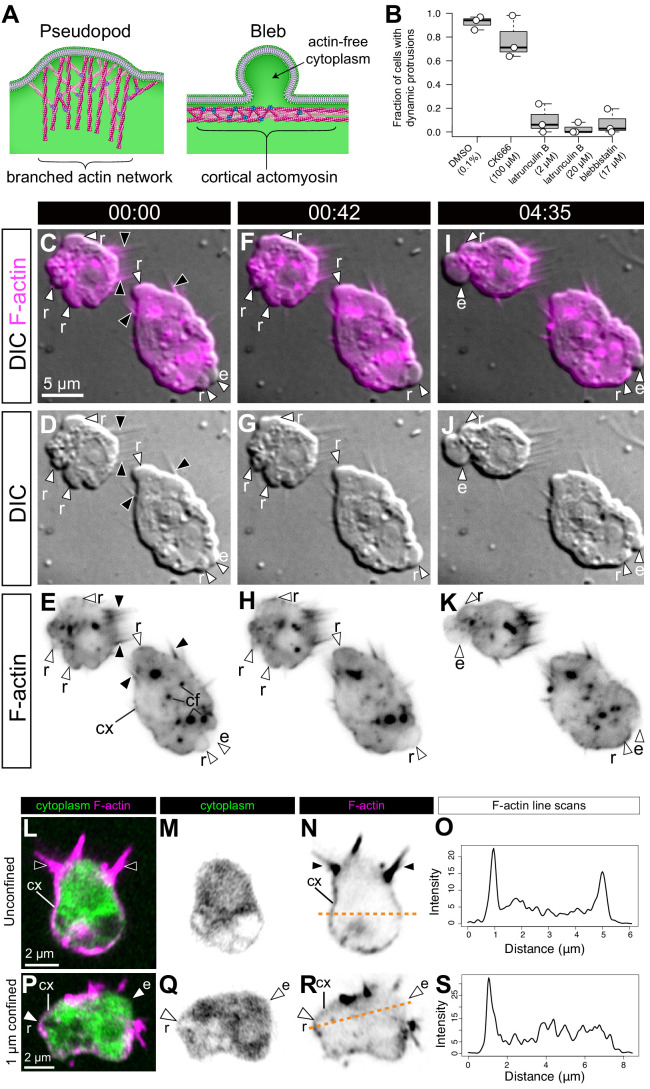
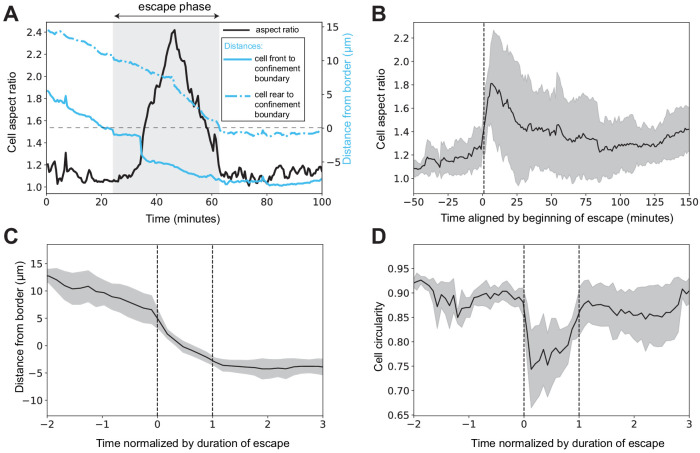
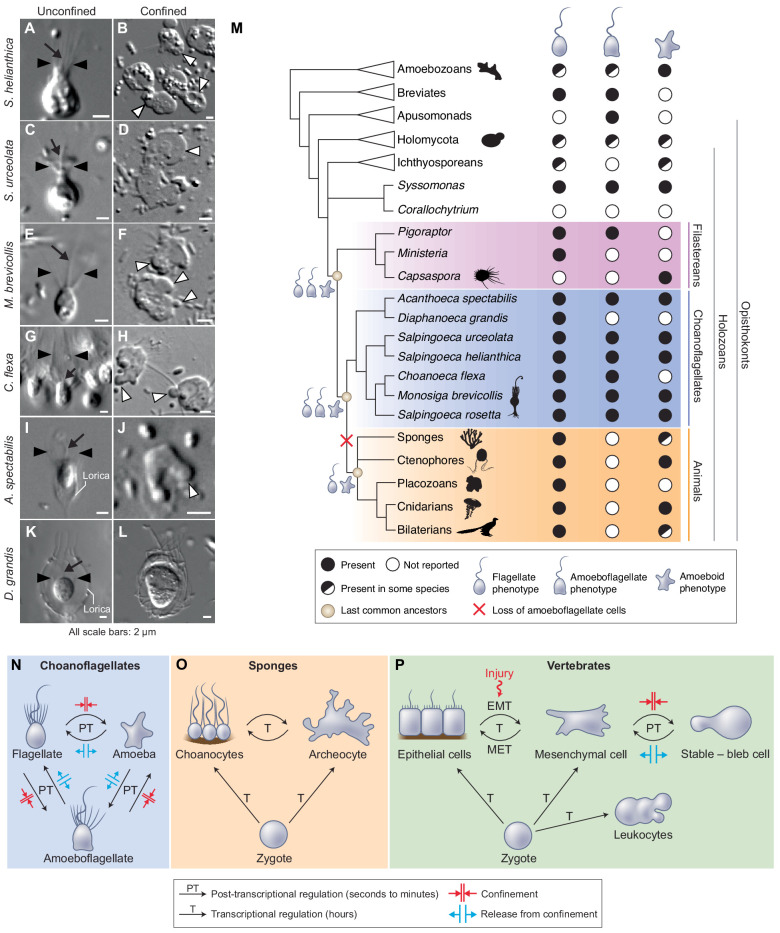
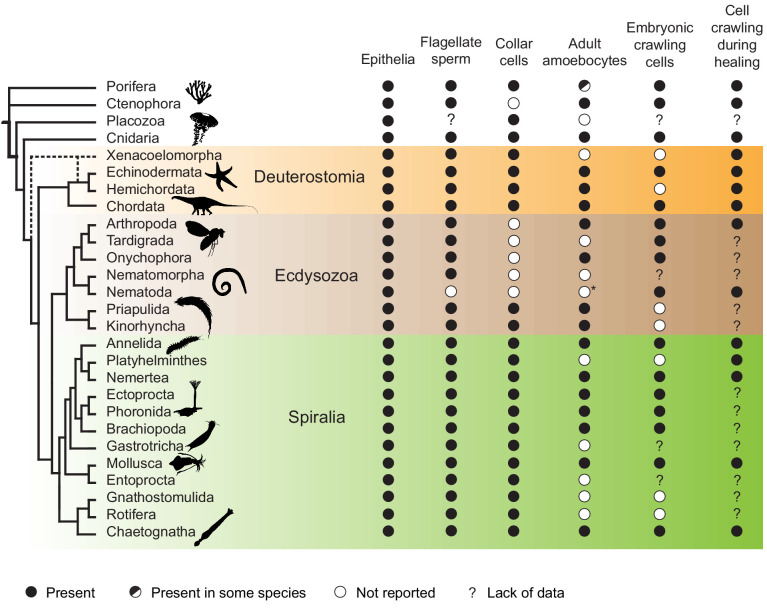
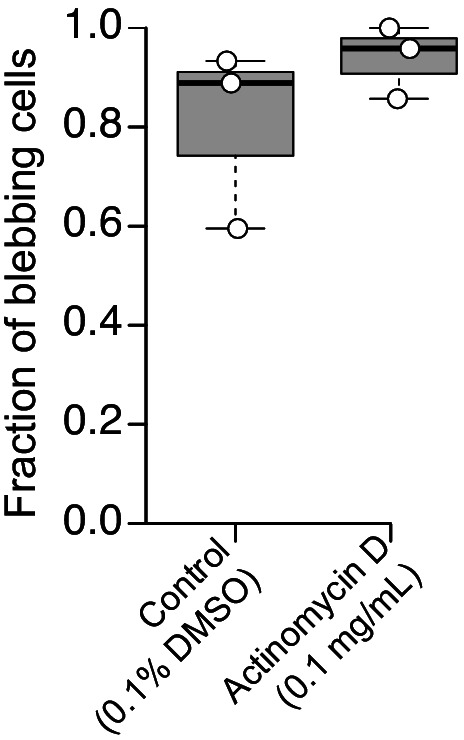
Amoeboid cell types are fundamental to animal biology and broadly distributed across animal diversity, but their evolutionary origin is unclear. The closest living relatives of animals, the choanoflagellates, display a polarized cell architecture (with an apical flagellum encircled by microvilli) that resembles that of epithelial cells and suggests homology, but this architecture differs strikingly from the deformable phenotype of animal amoeboid cells, which instead evoke more distantly related eukaryotes, such as diverse amoebae. Here, we show that choanoflagellates subjected to confinement become amoeboid by retracting their flagella and activating myosin-based motility. This switch allows escape from confinement and is conserved across choanoflagellate diversity. The conservation of the amoeboid cell phenotype across animals and choanoflagellates, together with the conserved role of myosin, is consistent with homology of amoeboid motility in both lineages. We hypothesize that the differentiation between animal epithelial and crawling cells might have evolved from a stress-induced switch between flagellate and amoeboid forms in their single-celled ancestors.

Keywords: Salpingoeca rosetta; animal origins; cell biology; cell type evolution; cellular proprioception; choanoflagellates; evolutionary biology; transdifferentiation.


Conflict of interest statement

TB, MA, WR, MC, DS, NK No competing interests declared

Figures

Figure 1.
Figure 1.. Confinement induces an amoeboid phenotype in the choanoflagellate S. rosetta.
(A) Free-swimming cells (bottom left) were confined (bottom right) at a fixed height using confinement slides with micro-spacers (Liu et al., 2015; Le Berre et al., 2014) (top). (B) Confined S. rosetta cells underwent a rapid phenotypic transition, first from a flagellate form into an amoeboflagellate form, and eventually into an amoeboid form (that initially retains microvilli). Releasing confinement reversed this transition. (C and D) Confinement height correlated with the phenotypic switch. (C) Representative cells at each confinement height tested. (D) The flagellate form dominated at >3 μm confinement and the amoeboid form (defined by the presence of dynamic protrusions) at <3 μm. The number of cells (technical replicates) per batch (biological replicate) was as follows: 14, 6, and 12 cells for 5 μm confinement; 5, 5, and 11 cells for 4 μm confinement; 28, 18, and 6 cells for 3 μm confinement; 11, 5, and 6 cells for 2 μm confinement; and 13, 11, and 21 cells for 1 μm confinement. (EJ) Time series of an S. rosetta cell switching to the amoeboid form at 2 μm confinement. See Figure 1—video 1 for multiple examples. (KP) Time series of an amoeboid S. rosetta cell reverting to the flagellate form after release from confinement. See Figure 1—video 2 for multiple examples. In all panels, white arrowheads indicate dynamic protrusions, black arrowheads indicate collar microvilli, and black arrows indicate the flagellum. Time stamps in black boxes shown as min:sec.
Figure 1—figure supplement 1.
Figure 1—figure supplement 1.. Flagellar retraction and regeneration during transitions between the flagellate and amoeboid forms.
(A) Most (but not all) S. rosetta cells retracted their flagellum within 500 s of confinement at 2 μm. (BD) The flagellum regenerated after release from confinement in approximately the same position as the original, retracted flagellum. (B) Time series of an S. rosetta cell retracting its flagellum under confinement and regenerating it after confinement release (Figure 1—video 2). The cell was attached to the glass substrate with poly-d-lysine to minimize cell movements. White arrowheads: dynamic protrusions, black arrowheads: microvilli, black arrow: flagellum. Time stamps in black boxes are min:sec. (Figure 1—video 2). (C) To compare the flagellar position before and after confinement, the flagellar emergence angle was measured relative to an invariant vertical line (parallel to the edge of the field of view). (D) The position of the regenerated flagellum after release from confinement in a population of cells was almost always close to the position of the original, retracted flagellum (as measured by the flagellar emergence angle; Figure 1—video 2). The cells sometimes underwent slight global reorientations under confinement (even though they were attached to the substrate with poly-d-lysine) that likely accounted for small differences in flagellar angle before and after confinement.
Figure 1—figure supplement 2.
Figure 1—figure supplement 2.. S. rosetta is competent to undergo the amoeboid switch in rosette and thecate forms.
(A) Schematic drawing of a rosette colony of S. rosetta (from Brunet and King, 2017). (BE) Cells within rosettes became amoeboid under 2 μm confinement. (A) An unconfined rosette. (C and D) Time series of a confined rosette, showing dynamic extension and retraction of protrusions. All cells switched to an amoeboid phenotype, but we did not observe any evidence of collective behavior (Figure 1). (E) Quantification of the amoeboid switch in rosettes from two biological replicates. Numbers refer to individual cells. (F) Schematic drawing of a thecate S. rosetta cell (from Brunet and King, 2017). Thecate cells are sessile and attached to the substrate through an extracellular lodge called a ‘theca’. (GJ) Thecate cells become amoeboid under 2 μm confinement. (G) An unconfined thecate cell. (H and I) A confined thecate cell, showing dynamic extension and retraction of protrusions. (J) Quantification of the amoeboid switch in a population of confined thecate cells. In all panels, white arrowheads: dynamic protrusions, black arrowheads: microvilli, black arrow: flagellum. Time stamps in black boxes are min:sec.
Figure 2.
Figure 2.. S. rosetta amoeboid cells generate blebs.
(A) Protrusions in eukaryotic crawling cells can either be F-actin-filled pseudopods that form by polymerization of F-actin (pink) reticulated by the Arp2/3 complex (purple, left) or F-actin-free blebs that form through the action of contractile forces in the actomyosin cortex underlying the plasma membrane (right). The cytosol is green in both panels. Modified from Fritz-Laylin et al., 2017a. (B) Formation of dynamic protrusions required F-actin and myosin II activity, but not Arp2/3-mediated F-actin polymerization. Protrusions were abundant in DMSO-treated control cells (N = 32, 34, and 50 cells in the three respective biological replicates) and in cells treated with the Arp2/3 inhibitor CK666 (100 μM, N = 47, 56, and 59 cells in the three respective biological replicates) but virtually absent in cells treated with the F-actin polymerization inhibitor latrunculin B (at both 2 μM [N = 33, 76, and 11 cells in the three respective biological replicates] and 20 μM [N = 32, 49, and 22 cells in the three respective biological replicates]) or the myosin II inhibitor blebbistatin (17 μM, N = 36, 77, and 17 cells in the three respective biological replicates). This suggests that the dynamic protrusions were blebs. All cells were under 1 μm confinement. (CK) Dynamic protrusions that form under confinement are blebs, as indicated by live imaging of two S. rosetta amoeboid cells expressing an F-actin marker (LifeAct-mCherry, magenta in C/F/I and black in E/H/K) (Video 5). (C, F, I and E, H, K) We observed that expanding blebs (e; defined as blebs that increased in size during the period of observation currently increasing in size) were cytoplasm-filled, but F-actin-free. We found that F-actin subsequently re-invaded blebs that then initiated retraction (r; defined as blebs that decreased in size during the period of observation). F-actin was also present as a cortical layer (cx), as in animal cells (Chugh and Paluch, 2018), and accumulated in cytoplasmic foci (cf). The cells were under 1 μm confinement. (LS) S. rosetta cells fixed and stained for F-actin (phalloidin, magenta) and cytoplasm (FM 1–43 FX, which distributes to the cytoplasm of S. rosetta following fixation, green) confirmed that the protrusions of amoeboid cells initially lack F-actin and are therefore blebs. (L to N) A flagellate cell showing collar microvilli (black arrowheads) and F-actin cortex (cx). (O) Linescan of F-actin fluorescent intensity along the line of interest in (N), showing cortical actin as two peaks where the lines intersects the cells cortex. (P–R) An amoeboid cell showing both F-actin-free and F-actin-encased protrusions, respectively, interpreted as expanding (e) and retracting (r) blebs. (S) Linescan of F-actin fluorescent intensity along the line of interest in (R), showing cortical actin in the putative retracting bleb but not the putative expanding bleb. In all panels: white arrowheads: blebs, black arrowheads: microvilli, e: expanding blebs, r: retracting blebs, cf: cytoplasmic foci. Time stamps in black boxes shown as min:sec.
Figure 2—figure supplement 1.
Figure 2—figure supplement 1.. Latrunculin B and blebbistatin, but not CK666, inhibited the formation of dynamic cellular protrusions under cell confinement.
Cellular phenotypes observed after pharmacological inhibitor treatments (as shown) under 1 μm confinement. White arrowheads indicate blebs.
Figure 2—figure supplement 2.
Figure 2—figure supplement 2.. Flow-through chamber for immunostaining of confined cells.
A flow-through chamber design was used to maintain confinement during immunostaining of amoeboid cells (see Materials and methods).
Figure 3.
Figure 3.. F-actin dynamics during the lifetime of a bleb.
Time lapse imaging of a LifeAct-mCherry-expressing live cell (Video 5) by DIC (left column) and fluorescence microscopy (middle column) revealed membrane dynamics and actin localization during bleb formation. Line scans (right column) were used to quantify LifeAct-mCherry fluorescence (indicating relative F-actin levels, middle column) along the outline of the plasma membrane (visualized by DIC microscopy, left column). Bleb initiation (at 01:03) and expansion (from 01:03 to 03:53) correlated with relative reduction of F-actin within the expanding bleb. F-actin re-invaded the bleb to reassemble the cortex (04:58) prior to bleb retraction (06:42–12:22). Timestamps shown as mm:ss. Time points correspond to key events during blebbing and are not evenly spaced. X-axis indicates distance along linescan from left-to-right intersection of cell membrane with the bottom boundary of the image. Y-axis indicates relative intensity in arbitrary units (AU).
Figure 4.
Figure 4.. Myosin II undergoes intracellular redistribution in response to confinement.
(A) Top: MRLC-mTFP fluorescence in four unconfined flagellate S. rosetta cells from a chain colony (Dayel et al., 2011). The position of the microvilli (black arrowheads) can be inferred from weak autofluorescence of bacteria captured by the collar. Asterisks (*) indicate fluorescent signal from the food vacuole (possibly due to autofluorescence of phagocytosed bacteria and/or to fluorescent protein degradation by autophagy; Wetzel et al., 2018). Most MRLC-mTFP is cytoplasmic but a cortical basal patch (bp) can be observed. Bottom: linescan of MRLC-mTFP fluorescence intensity along the line of interest (A; red dotted line), showing both diffuse cytoplasmic staining and cortical staining at the basal patch. (B) MRLC-mTFP is redistributed in less than a minute in response to confinement, from a diffuse cytoplasm staining into discrete cortical and cytoplasmic foci and fibers. Time-lapse of two MRLC-mTFP-expressing S. rosetta cells before, during and after establishment of 1 μm confinement. (cf): cytoplasmic foci, arrows: cortical foci and fibers, (*): food vacuole signal. (C) Top: confocal images of MRLC-mTFP in representative unconfined, 2 μm-confined and 1 μm-confined S. rosetta. Black arrows: cortical foci. See Figure 4—figure supplement 1 for more cells. Bottom: line scans along the lines of interest in the top panels. Cortical foci of myosin II appear as peaks where the line of interest (red dotted line) intersects the cell cortex. (D) Myosin II is enriched at the cortex of confined cells, as manifested by an increase in the cortical/cytoplasmic ratio in MRLC-mTFP fluorescence. Results are depicted as a SuperPlot (Lord et al., 2020) where large dots are biological replicates (batches of cells) and small dots technical replicates (individual cells). p=2.5 × 10−2 and 1.3 × 10−2 by Dunnett’s test for comparison of multiple treatments to a control, for 2 and 1 μm confinement, respectively. (E) Half-confined cells (partly trapped under a micropillar used for confinement, see Figure 1A) only show condensation of myosin II into foci and fibers (arrows) in the confined part of the cell. (F) Localization of MRLC-mTFP in a blebbing amoeboflagellate cell under 1 μm confinement (Video 9; see also Figure 4—video 1). Myosin II is absent from expanding blebs (e; defined as in Figure 2) but re-invades retracting blebs (r).
Figure 4—figure supplement 1.
Figure 4—figure supplement 1.. Confinement results in redistribution of MRLC-mTFP from the cytoplasm to the cortex.
All panels are confocal images of MRLC-mTFP-expressing S. rosetta cells, unconfined (A) or confined with 2 μm (B) or 1 μm (C) microbeads. Cells were imaged as early as possible (less than a minute) after having been confined. Arrows: cortical foci and fibers.
Figure 4—figure supplement 2.
Figure 4—figure supplement 2.. Microtubules are present in S. rosetta amoeboid cells.
(AD) Flagellate S. rosetta cells are characterized by a cage of cortical microtubules that underlie the entire plasma membrane, as previously reported (Karpov and Leadbeater, 1998; Leadbeater, 2015; Sebé-Pedrós et al., 2013a). A representative flagellated cell (previously published in Brunet et al., 2019) fixed and stained for F-actin (rhodamine-phalloidin, red), α-tubulin (YOL3/4 antibody, white), and DNA (Hoechst, blue). (EH) Amoeboid S. rosetta cells still display a microtubule cage, but it is detached from the plasma membrane and surrounds the nucleus. The cell was confined (1 μm), fixed, and stained for F-actin (rhodamine-phalloidin, red), β-tubulin (E7 antibody, white), and DNA (Hoechst, blue). In all panels, black arrowheads: microvilli, arrows: flagellum.
Figure 4—figure supplement 3.
Figure 4—figure supplement 3.. The amoeboid switch is independent of calcium signaling.
(AD) Representative micrographs of S. rosetta cells under 2 μm confinement under the following conditions: (A) in control conditions (AKSW 0.1% DMSO), (B) after intracellular calcium depletion (with 327 μM of the cell-permeant calcium chelator BAPTA-AM), (C) after extracellular calcium depletion (calcium-free AKSW [CF-AKSW] with 20 mM of the calcium chelator EGTA), and (D) after both extracellular and intracellular calcium depletion (CF-AKSW with EGTA and BAPTA-AM). Blebs (white arrowheads) were frequently observed in all conditions. bd: 2 μm microbeads used as spacers. (E) Quantification of blebbing activity reveals no differences under calcium depletion. Relative blebbing activity of individual cells was quantified by automated cell segmentation and measuring the rate of change of cell shape outline in time (see Materials and methods). Results are depicted as a SuperPlot (Lord et al., 2020) in which small dots are individual cells and large dots are median values per cell population. Each cell population was treated and imaged as an independent biological replicate. Color of small dots reflects the cell population they belong to. p=0.95, 0.91, and 1, respectively, for comparisons of the BAPTA-AM, CF-AKSW, and CF-AKSW+BAPTA-AM conditions to the control (by Dunnett’s test for comparison of multiple samples to a control). Number of biological replicates and number of cells were, respectively, AKSW 1% DMSO control: N = 7 replicates, n = 1252 cells; AKSW BAPTA-AM: N = 6, n = 921; CF-AKSW: N = 7, n = 896; CF-AKSW+BAPTA-AM: N = 9, n = 1439.
Figure 5.
Figure 5.. The amoeboid switch allows escape from confinement.
(AD) Amoeboid cell crawling after flagellar retraction (Figure 1—video 1). White arrow indicates direction of movement. (E and F) Speed and directional persistence of the cells in Figure 1—video 1 (2 μm confinement). Directional persistence was defined as the ratio of the total path to the Euclidean distance over 2 min. (G and H) Violin plots showing speed and directional persistence measured over 100 min under 0.5 μm (Figure 5—video 1, non-escaping cells under the micropillar – see following panels), 2 μm (Figure 1—video 1), and 3.5 μm (Figure 5—video 1, cells outside the micropillar – see following panels) confinement. (I) mTFP-expressing S. rosetta cells (cyan; confined cells that escaped during the assay indicated with small arrows) distributed within and outside the confinement zone (border indicated with larger arrow) at the beginning of an escape assay (Figure 5—video 1). (J) Schematic of cross-section through escape assay set-up from (I). (K) Time series of an mTFP-expressing cell (arrow) during escape from confinement (top, DIC; middle, mTFP; bottom, segmentation of mTFP fluorescence to reveal cell shape; Figure 5—video 2). Automated detection of the long (blue) and short (red) axes of the cell revealed that the cell elongated during crossing of the confinement border and relaxed into a more rounded shape once escape was complete. (L) Cells crawled directionally during escape. Bullseye diagram showing the distribution of angular differences between crawling and the shortest possible escape path in escaping cells (N = 8). (M) Escaping cells (N = 8) consistently elongated during escape and resumed a rounder shape once in the unconfined area. Escape also corresponded to a decrease in the projected area of the cell. Mean aspect ratio (red line) and projected area (blue line), ribbons: standard deviation. (N) Escaping cells acquired a highly elongated shape. Non-escaping cells did not reach comparable elongation levels, as indicated by the peak aspect ratio. Results are depicted as a SuperPlot (Lord et al., 2020) with biological replicates (time-lapse movies of a cell population) represented as large dots and technical replicates (individual cells within each movie) as small dots. Replicate 1 (blue dots) included 81 cells of which six escaped (p=2.2 × 10−4 by Mann–Whitney’s U test). Replicate 2 (orange dots) included 13 cells of which two escaped (p=3.0 × 10−2 by Mann–Whitney’s U test). (O) Escape required myosin II activity. Control cells (three biological replicates with N = 95, 35, and 12 cells) almost always escaped confinement if they were initially located less than 5 μm away from the border, and some escaped from as far as 15 μm. Seventeen micromolar blebbistatin-treated cells (two biological replicates with N = 110 and 73 cells) virtually never escaped. Time stamps in black boxes shown as min:sec.
Figure 5—figure supplement 1.
Figure 5—figure supplement 1.. Amoeboid cells elongate during escape from confinement and revert to a rounded shape after escape.
(A) Aspect ratio of a representative escaping cell before, during, and after escape (black line). The aspect ratio increased during escape and decreased after escape. Also depicted is the distance between the confinement border and the front or the rear end of the cell (full and dotted blue lines, respectively). The escape phase (in Figure 5K and panels C and D) is defined and automatically recognized as the time after the front end of the cell crossed the confinement boundary and before the rear end of the cell did. Distance from the border is defined as positive inside the confinement zone and negative in the unconfined space. (B) Average aspect ratio of escaping cells as a function of absolute time, aligned by beginning of escape. (C) Distance from the border as a function of time (normalized by duration of the escape phase) in escaping cells. (D) Cell shape circularity decreased during escape, but resumed a high value once escape was complete, reflecting elongation of the cell during escape (A, B, and Figure 5K–L). In (B) and (C), black line is the average value of the metric of interest and gray ribbon is the standard deviation (N = 8 escaping cells for all panels).
Figure 6.
Figure 6.. The last common choanozoan ancestor likely had amoeboid and flagellate life-history stages.
(A–J) Five of six choanoflagellate species tested underwent the amoeboid transition under 2 μm confinement (Videos 12–15). (KL) In contrast, the loricate choanoflagellate Diaphanoeca grandis was passively flattened under 2 μm confinement, but did not generate blebs (Figure 6—video 1). (M) Phylogenetic distribution of flagellate, amoeboflagellate, and amoeboid cell phenotypes in animals, fungi, amoebozoans, and their relatives. We infer that the last common ancestor of choanoflagellates and animals was able to differentiate into flagellate, amoeboid, and amoeboflagellate forms. Flagellate and amoeboid forms were likely both still present in the last common ancestor of all animals. See Figure 6—figure supplement 1 and Supplementary file 1 for full supporting evidence regarding the distribution of cellular phenotypes in animals. Species silhouettes are from Phylopic (http://phylopic.org). (N–P) Commonalities and differences in the regulation of cellular phenotypic transitions in choanoflagellates, sponges, and vertebrates. (N) Choanoflagellates can rapidly alternate (in a matter of minutes) between flagellate, amoeboflagellate, and amoeboid forms based on degree of external confinement (Figure 1). Inhibition of transcription does not prevent transitions between amoeboid and flagellate forms, suggesting that the transition is post-transcriptionally regulated (Figure 6—figure supplement 2). (O) In sponges, the zygote can give rise to flagellated choanocytes and amoeboid archeocytes. Choanocytes and archeocytes can reversibly interconvert, but this process takes several hours and likely requires transcriptional regulation (Sogabe et al., 2019). (P) In vertebrates, multicellular development from the zygote results in terminal differentiation of ciliated epithelial cells, mesenchymal cells and amoeboid leukocytes, but injury can trigger differentiation of epithelial cells into crawling mesenchymal cells (by epithelial-to-mesenchymal transition or EMT [Lamouille et al., 2014; Dongre and Weinberg, 2019]) that respond to confinement by switching to a stable-bleb form capable of amoeboid migration (Liu et al., 2015; Ruprecht et al., 2015). The switch from epithelial to mesenchymal cells is reversible (by mesenchymal-to-epithelial transition or MET).
Figure 6—figure supplement 1.
Figure 6—figure supplement 1.. Phylogenetic distribution of crawling cells, epithelial cells, collar cells, and flagellated sperm cells in animals.
Shown is a phylogenetic tree (modified from Brunet and King, 2017) along with information about the presence or absence (see key) of relevant cell types and cell behaviors in diverse animal lineages. Most animal lineages have crawling cells during both embryonic and adult life-history stages. In lineages that lack adult crawling cell types, cell crawling is still often observed in embryonic cells or during wound healing. This phylogenetic distribution suggests that cell crawling was present in the last common animal ancestor – although it might have been restricted to transient developmental or physiological processes (such as primordial germ cell migration or wound healing, respectively), rather than a long-term property of a stable cell type. Cell crawling is seemingly absent from five phyla (Placozoa, Nematomorpha, Gastrotricha, Gnathostomulida, and Rotifera), which might reflect lack of data rather than a genuine absence as embryonic development and wound healing are generally little studied in those groups. Note that amoeboid cell types are thought to be absent in certain lineages within some phyla – such as Calcaronea and possibly Homoscleromorpha within sponges (Adamska, 2016). See Supplementary file 1 for underlying data and references. Species silhouettes are from Phylopic (http://phylopic.org).
Figure 6—figure supplement 2.
Figure 6—figure supplement 2.. The amoeboid switch is not affected by transcription inhibition.
The fraction of blebbing cells was comparable in DMSO-treated controls (left, N = 42, 60, and 9 cells in three respective biological replicates) and in cells treated with an RNA-polymerase II inhibitor (0.1 mg/mL actinomycin D; N = 12, 15, and 5 cells in three respective biological replicates).

Comment in

Similar articles

Cited by

References

    1. Adamska M. Sponges as models to study emergence of complex animals. Current Opinion in Genetics & Development. 2016;39:21–28. doi: 10.1016/j.gde.2016.05.026. - DOI - PubMed
    1. Alegado RA, Brown LW, Cao S, Dermenjian RK, Zuzow R, Fairclough SR, Clardy J, King N. A bacterial sulfonolipid triggers multicellular development in the closest living relatives of animals. eLife. 2012;1:e00013. doi: 10.7554/eLife.00013. - DOI - PMC - PubMed
    1. Allan D, Caswell T, Wel CVD. v0.4.2Soft-Matter/Trackpy: Trackpy v0.4.2. 2019 https://zenodo.org/record/3492186#.YAPS9OgzbIU
    1. Arendt D, Benito-Gutierrez E, Brunet T, Marlow H. Gastric pouches and the mucociliary sole: setting the stage for nervous system evolution. Philosophical Transactions of the Royal Society B: Biological Sciences. 2015;370:20150286. doi: 10.1098/rstb.2015.0286. - DOI - PMC - PubMed
    1. Arendt D, Musser JM, Baker CVH, Bergman A, Cepko C, Erwin DH, Pavlicev M, Schlosser G, Widder S, Laubichler MD, Wagner GP. The origin and evolution of cell types. Nature Reviews Genetics. 2016;17:744–757. doi: 10.1038/nrg.2016.127. - DOI - PubMed

Publication types