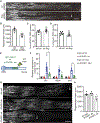
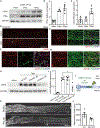
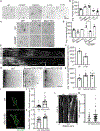
. 2023 Jan 18;111(2):236-255.e7.
doi: 10.1016/j.neuron.2022.10.028. Epub 2022 Nov 11.

Driving axon regeneration by orchestrating neuronal and non-neuronal innate immune responses via the IFNγ-cGAS-STING axis

Affiliations

Driving axon regeneration by orchestrating neuronal and non-neuronal innate immune responses via the IFNγ-cGAS-STING axis

Xu Wang et al. Neuron. .

Abstract

The coordination mechanism of neural innate immune responses for axon regeneration is not well understood. Here, we showed that neuronal deletion of protein tyrosine phosphatase non-receptor type 2 sustains the IFNγ-STAT1 activity in retinal ganglion cells (RGCs) to promote axon regeneration after injury, independent of mTOR or STAT3. DNA-damage-induced cGAMP synthase (cGAS)-stimulator of interferon genes (STINGs) activation is the functional downstream signaling. Directly activating neuronal STING by cGAMP promotes axon regeneration. In contrast to the central axons, IFNγ is locally translated in the injured peripheral axons and upregulates cGAS expression in Schwann cells and infiltrating blood cells to produce cGAMP, which promotes spontaneous axon regeneration as an immunotransmitter. Our study demonstrates that injured peripheral nervous system (PNS) axons can direct the environmental innate immune response for self-repair and that the neural antiviral mechanism can be harnessed to promote axon regeneration in the central nervous system (CNS).

Keywords: PTPN2; STAT1; axon regeneration; cGAS-STING; dorsal root ganglions; interferon gamma; optic nerve injury; retinal ganglion cells.


Conflict of interest statement

Declaration of interests The authors declare no competing interests.

Figures
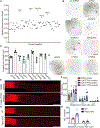
Figure 1.
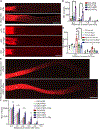
Figure 1.. Functional screening identifies Ptpn2 as a suppressor of axon regeneration
(A) Quantification of in vitro screening on shRNAs of mouse phosphatases. (B) Sample images of replated neurons from respective shRNA groups with Tuj1 staining. Scale bars, 400 μm. (C) Quantification of in vitro screening on inhibitors of mouse phosphatases. ANOVA followed by Dunnett’s test, n = 3 mice. (D) Sample images of replated neurons from respective treatment groups with Tuj1 staining. Scale bars, 400 μm. (E) Sections of optic nerves with cholera toxin B subunit (CTB) labeling from WT mice at 2 weeks post-injury (WPI). Scale bars, 200 μm. (F) Number of regenerating axons at indicated distances from the lesion site. ANOVA followed by Tukey’s test, n = 4–12 mice. (G) Sections of optic nerves from WT or Ptpn2 floxed mice at 2 WPI. The Ptpn2 conditional knockout (cKO) was induced by intravitreal injection of AAV-Cre. Scale bars, 200 μm. (H) Number of regenerating axons at different distances from the lesion site. ANOVA followed by Bonferroni’s test, n = 6 mice. Mean ± SEM; *p
Figure 2.
Figure 2.. Ptpn2 deletion effect is boosted by IFNγ and synergizes with Pten/Socs3 codeletion for long-distance axon regeneration
(A) Sections of optic nerves from WT or Ptpn2 cKO mice with IFNγ treatment. Scale bars, 200 μm. (B) Number of regenerating axons at indicated distances distal to the lesion site. ANOVA followed by Tukey’s test, n = 4–8 mice. (C) Sections of optic nerves from Ptpn2 cKO mice with AAV-sh-Ctrl. Sh-Ifngr1 or sh-Ifngr2. Scale bars, 200 μm. (D) Number of regenerating axons at indicated distances distal to the lesion site. ANOVA followed by Tukey’s test, n = 4–5 mice. (E) Section of optic nerves from Pten; Socs3 double-floxed mice or Pten; Socs3; Ptpn2 triple-floxed mice at 2WPI. The vitreous body was injected with AAV-Cre combined with AAV-CNTF. IFNγ or PBS was injected into the vitreous body immediately after optic nerve injury. Asterisks indicate the lesion site. Scale bars, 500 μm. (F) Quantification of regenerating axons at indicated distances from the lesion site. ANOVA followed by Bonferroni’s test, n = 4–5 mice. Mean ± SEM; *p
Figure 3.
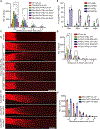
Figure 3.. Neuronal Ptpn2 deletion sustains IFNγ-IFNGR-Stat1 signaling to promote axon regeneration in CNS
(A) Number of regenerating axons at indicated distances distal to the lesion site, ANOVA followed by Tukey’s test, n = 4–6 mice. (B) Quantification of the percentage of p-STAT1+ RGCs at indicated time points after injury in Figure S3E. ANOVA followed by Bonferroni’s test. n = 3–5 mice. (C) Sections of optic nerves from WT, Mtor floxed, Jak1 floxed, or Stat3 floxed mice at 2WPI. The vitreous body was injected with AAV-Cre or AAV-sh-Stat1 combined with AAV-sh-Ptpn2 plus IFNγ. Scale bar, 200 μm. (D) Number of regenerating axons at indicated distances from the lesion site. ANOVA followed by Tukey’s test, n = 4–6 mice. (E) Sections of optic nerves from WT or Stat3 floxed mice at 2WPI. The vitreous body was injected with AAV-Cre, AAV-sh-ctrl or AAV-sh-Stat1 combined with AAV-CNTF. Scale bar, 200 μm. (F) Quantification of regenerating axons at indicated distances distal to the lesion site. ANOVA followed by Tukey’s test, n = 4 mice. Mean ± SEM; *p
Figure 4.
Figure 4.. cGAS-STING cytosolic DNA sensing pathway mediates axon regeneration induced by IFNγ
(A) Retinal sections from WT or Ptpn2 cKO mice with PBS or IFNγ treatment. The samples were collected 2 dpc and stained for Tuj1 (green), and cGAS (red). Scale bar, 50 μm. (B) Quantification of the percentage of cGAS+ RGCs in (A). ANOVA followed by Dunnett’s test. n = 3–4 mice. (C) Retinal sections from WT intact, cKO intact or WT+CPT mice stained with dsDNA (green), TOMM20 (red), and Tuj1 (gray). Scale bar, 2 μm. (D) Quantification of relative cytoplasmic DNA intensity from (E). ANOVA followed by Dunnett’s test. n = 11–25 cells. (E) Sections of optic nerves from WT, Cgas KO, Sting KO, or Mavs KO mice at 2WPI. The vitreous body was injected with AAV-sh-Ptpn2 plus IFNγ. Scale bars, 200 μm. (F) Number of regenerating axons at indicated distances from the lesion site. ANOVA followed by Tukey’s test, n = 3–4 mice. (G) Quantification of regenerating axons in WT, Cgas KO, Sting KO, or Mavs KO mice. ANOVA followed by Tukey’s test, n = 3 mice. (H) Sections of optic nerves from WT mice at 2 WPI, with PBS or 25-mM cGAMP treatment. Scale bar, 200 μm. (I) Number of regenerating axons at indicated distances from the lesion site. ANOVA followed by Tukey’s test, n = 3 mice. Mean ± SEM; *p
Figure 5.
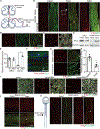
Figure 5.. Axonal IFNγ is locally translated upon axotomy in PNS but not in CNS
(A) A diagram shows the method of sciatic nerve injury and spinal cord injury. Arrowhead labels the location of the lesion site. (B) Longitude sections of sciatic nerves from WT animals at different time points (intact, 3 hpc and 3 dpc) after injury, stained with IFNγ (red) and NFH (green) antibodies. Scale bars, 200 μm. Zoomed-in images of the 3 hpc sciatic nerve section from (B) are shown in (B). Scale bars, 50 μm. Asterisks indicate the lesion site. (C) Cross sections of sciatic nerves from WT animal at 3 dpc, stained with IFNγ (red), MBP (white), and NFH (green) antibodies. Scale bars, 10 μm. (D) Validation of IFNγ expression in DRG or sciatic nerve lysate by western blot. (E) Quantification of IFNγ expression in (D). ANOVA followed by Tukey’s test, n = 3 mice. (F) Representative images of the longitude section of an intact sciatic nerve. IFNγ mRNA (red) was stained by in situ hybridization and Tuj1 protein was stained by the antibody. Arrowheads indicate the axonal IFNγ mRNA. Scale bar, 20 μm. (G) Sections of injured nerve segments after 4 h DMEM incubation with control or anisomycin, stained with IFNγ (red) and NFH (green). Asterisks indicate the lesion site. Scale bar, 100 μm. (H) Quantification of the relative intensity of IFNγ in (G). Student’s t test, n = 4 nerves. (I) Cross sections of injured sciatic nerves from WT animals with intrathecal injection of AAV-ctrl or Ifng-shRNA were stained with IFNγ (red), MBP (gray), and NFH (green). Scale bars, 10 μm. (J) Sections of the spinal cord from Thy1-GFP animal before injury or at 3 hpc after injury, stained with IFNγ (red) and GFP (green) antibodies. Asterisk labels the location of the lesion site. Scale bar, 400 μm. (K) A diagram shows the method of optic nerve injury. Confocal images are sections of the optic nerve from Thy1-GFP animal before injury or at 3 hpc after injury, stained with IFNγ (red) and GFP (green) antibodies. Asterisk labels the location of the lesion site. Scale bar, 50 μm. Mean ± SEM; *p
Figure 6.
Figure 6.. Axonal IFNγ and its subsequent activation within the nerve are required for the peripheral axon regeneration
(A) Representative sections from sciatic nerves of WT animals with respective virus injection at 3 dpc. Regenerating axons were visualized by SCG10 staining. Dotted lines indicate the proximal side of the lesion site and arrowheads indicate the terminals of longest regenerating axons. Scale bar, 200 μm. (B) Quantification of sensory axon regeneration in (A). Student’s t test, n = 4 mice. (C) Quantification of percentages of pSTAT3 positive DRG neurons at 3 dpc. Sciatic nerve crush was done 4 weeks after AAV-ctrl or Ifng-shRNA injection. ns, not significant, Student’s t test, n = 4 mice. (D) Quantification of percentages of pcJun positive DRG neurons at 3 dpc. Sciatic nerve crush was done 4 weeks after AAV-ctrl or Ifng-shRNA injection. ns, not significant, Student’s t test, n = 4 mice. (E) A diagram shows the method of sciatic nerve injection of antibody. (F) qPCR analysis of ISG expression in at 1 dpc. Ctrl or IFNGR1 antibody was injected into the sciatic nerve after injury. ANOVA followed by Tukey’s test, n=4 mice. (G) Representative sections from sciatic nerves of WT animals with respective antibody injection at 3 dpc. Scale bar, 200 μm. (H) Quantification of sensory axon regeneration of respective groups in (G). ANOVA followed by Dunnett’s test, n = 4 mice. Mean ± SEM; *p
Figure 7.
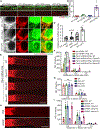
Figure 7.. Axonal IFNγ upregulates cGAS in the non-neuronal cells of the sciatic nerve to promote regeneration
(A) Western blots of IFNγ and cGAS in sciatic nerve lysate at different time points after injury. (B) Quantification of IFNγ expression level in (A). ANOVA followed by Dunnett’s test, n = 3 mice. (C) Quantification of cGAS expression level in (A). n = 3 nerves. ANOVA followed by Dunnett’s test, n = 3 mice. (D) Sections of intact or 3 dpc sciatic nerves from WT animal, stained with cGAS (red) antibody. Asterisk labels the lesion site. Scale bars, 200 μm. (E) Section of a sciatic nerve from WT animal at 3 dpc was stained with Tuj1 (green) and cGAS (red). Arrowhead labels cGAS+/Tuj1— cells. Scale bars, 50 μm. (F) Section of a sciatic nerve from WT animal at 3 dpc was stained with CD45 (green) and cGAS (red). Arrow labels double-positive cells and arrowhead labels cGAS+/CD45— cells. Scale bars, 50 μm. (G) Section of a sciatic nerve from WT animal at 3 dpc was stained with S100b (green) and cGAS (red). Arrow labels double-positive cells and arrowhead labels cGAS+/ S100b— cells. Scale bars, 50 μm. (H) Western blots of cGAS in sciatic nerve lysate at 1 dpc. Ctrl, IFNAR1 or IFNGR1 neutralizing antibodies were injected into the sciatic nerve after injury. (I) Quantification of cGAS expression in (H). n = 3–4 nerves. ANOVA followed by Dunnett’s test. (J) A diagram shows the method of sciatic nerve injection of DMSO vehicle or RU.521. (K) Representative sections from sciatic nerves of WT animals with DMSO vehicle or RU.521 injection. Scale bars, 200 μm. (L) Quantification of sensory axon regeneration in (K). Student’s t test, n = 4–5 mice. Mean ± SEM; *p
Figure 8.
Figure 8.. cGAMP promotes peripheral axon regeneration through axonal STING
(A) Representative images of DRG neurons in primary cultures treated with DMSO vehicle, cGAMP (10 μM), DMXAA (10 μM), C-176 (1 μM), or H-151 (1 μM). Scale bar, 400 μm. (B) Quantification of lengths of the longest axon for each DRG neuron in (A). n = 3 mice. ANOVA followed by Dunnett’s test. (C) Representative images of DRG neurons from WT, Sting KO, or Mavs KO mice in primary cultures treated with DMSO vehicle or cGAMP (10 μM). Scale bar, 400 μm. (D) Quantification of lengths of the longest axon for each DRG neuron in (C). n = 3 mice. ANOVA followed by Tukey’s test. (E) Representative sections from sciatic nerves of WT animals with DMSO or H151 (1 μM) injection at 3 dpc. Scale bar, 200 μm. (F) Quantification of sensory axon regeneration in (E). Student’s t test, n = 4 mice. (G) Representative images of embryonic DRG culture in the compartmented chamber treated with PBS or ADU-S100 (10 μM). Scale bar, 400 μm. (H) Quantification of neurite lengths in (E). ANOVA followed by Dunnett’s test, n = 6 batches of primary culture. (I) Representative images of growth cones of EB1-GFP transfected DRG neurons treated with PBS or ADU-S100 (10 μM). Scale bar, 5 μm. (J) Quantification of growth cone area in (I). Each dot represents a DRG neuron. Student’s t test, n = 20 cells. (K) Quantification of EB1-GFP intensity in (I). Each dot represents a DRG neuron. Student’s t test, n = 20 cells. (L) Kymograph showing EB1-GFP comet tracking in live cell imaging in (I). (M) Quantification of highest EB1-GFP comet velocity during 2 min live imaging. Each dot represents a single EB1-GFP comet. Student’s t test, n = 65 for control group and 144 for ADU-S100 group. Mean ± SEM; *p

Comment in

Similar articles

Cited by

References

    1. Chandran V, Coppola G, Nawabi H, Omura T, Versano R, Huebner EA, Zhang A, Costigan M, Yekkirala A, Barrett L, et al. (2016). A systems-level analysis of the peripheral nerve intrinsic axonal growth program. Neuron 89, 956–970. 10.1016/j.neuron.2016.01.034. - DOI - PMC - PubMed
    1. Neumann S, and Woolf CJ (1999). Regeneration of dorsal column fibers into and beyond the lesion site following adult spinal cord injury. Neuron 23, 83–91. - PubMed
    1. Hilton BJ, Husch A, Schaffran B, Lin TC, Burnside ER, Dupraz S, Schelski M, Kim J, Müller JA, Schoch S, et al. (2022). An active vesicle priming machinery suppresses axon regeneration upon adult CNS injury. Neuron 110, 51–69.e7. 10.1016/j.neuron.2021.10.007. - DOI - PMC - PubMed
    1. Palmisano I, Danzi MC, Hutson TH, Zhou L, McLachlan E, Serger E, Shkura K, Srivastava PK, Hervera A, Neill NO, et al. (2019). Epigenomic signatures underpin the axonal regenerative ability of dorsal root ganglia sensory neurons. Nat. Neurosci 22, 1913–1924. 10.1038/s41593-019-0490-4. - DOI - PubMed
    1. Weng YL, Wang X, An R, Cassin J, Vissers C, Liu Y, Liu Y, Xu T, Wang X, Wong SZH, et al. (2018). Epitranscriptomic m(6)A regulation of axon regeneration in the adult mammalian nervous system. Neuron 97, 313–325.e316. 10.1016/j.neuron.2017.12.036. - DOI - PMC - PubMed

Publication types

MeSH terms

Substances